Accounting reports are necessary for every business to have. It helps you understand where your business heads, keep you on track to make enough profit, and so much more.
A lot of small businesses don’t hire an accountant. They may not have the money to hire one, and they may not have the time to learn how to account.
In reality, the software required to create these reports is expensive and hard to use. However, that is not the case with Vencru.

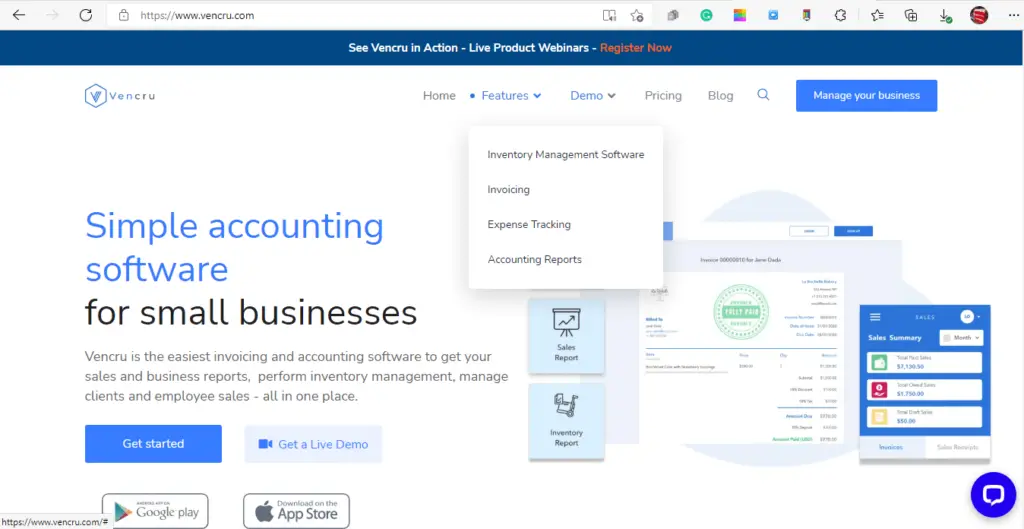
Vencru is one of the best accounting and invoicing software for small businesses. It can help you automate your accounting processes and cover all your invoicing needs.
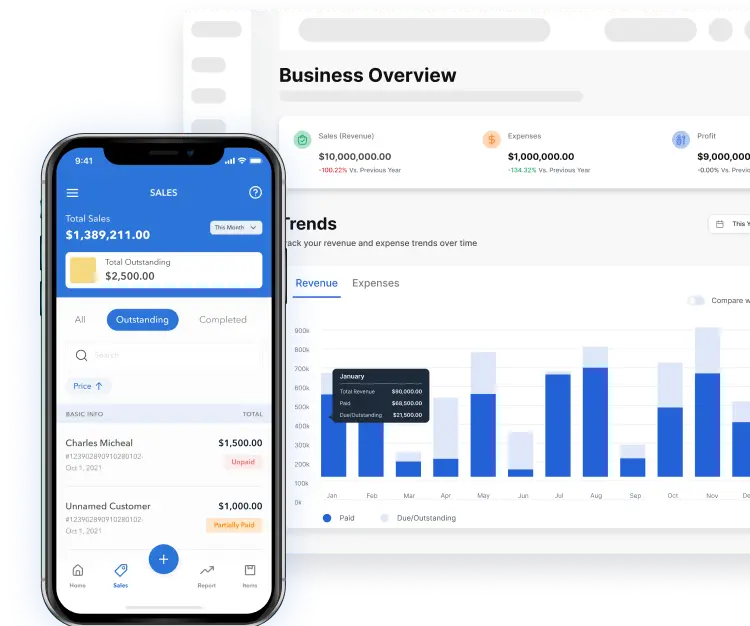
With the help of Vencru, you can create excellent accounting reports and get all the information you need for the accounting financial reports.
Accounting reports are a key aspect of running a small business. Whether for a small business, an online business, or an established business.
Business owners need to know how to get the basic accounting reports to measure the success of their business.
In this guide, we’ll look at how you can create your accounting reports.
What Is An Accounting Report?
An accounting report is a document prepared by a business’s accountant, summarizing the financial condition of the company at a point in time. Accounting reports are a standard part of business operations.
They provide business owners and managers with a snapshot of their company’s financial activity and performance.
In addition to helping business owners understand the health of their business, accounting reports enable owners to make strategic decisions about the growth and direction of their business.
Besides being used by lenders, investors, and other stakeholders to determine the financial health of a business, these accounting reports are also available to the public via government agencies.
Why You Need To Create Accounting Reports
Accounting reports will help you keep track of business transactions. They will also help you maintain a budget and forecast revenue. Enabling you to assess the current situation compared to previous ones and forecasts.
Accountants use them to analyze the data and communicate it effectively. Top management uses these reports to make informed decisions about investments, sales, purchases, etc. Accounting reports will give you a clear picture of how much money you earn each month.
You’ll be able to see if there’s any difference between what you earned in the previous and present year.
This information will help you plan for expenses and income. With a solid data visualization tool, you’ll be able to compare your results to those of other companies. You’ll be able to use these comparisons to inform your decision-making.
5 Steps For Creating An Accounting Report
Accounting reports are used to show the financial health of a company. They’re important tools for managers who want to keep track of their employees’ performance.
Creating accounting reports is not always easy. It can take hours or even days to create one report from scratch.
The 5 steps for creating an accounting report are:
- Know who you are creating the report for
- Collecting data
- Write an executive summary
- Writing the report
- Summarize and conclude
Know Who You Are Creating The Report For
Before preparing any content or compiling data, you’ll need to determine who the report is for and what information should be included.
GAAP dictates that businesses must disclose all of their financial dealings to their shareholders and investors. Therefore, your report may differ based on who it’s intended.
You may not want to share too much information with the people who work for you. Before you prepare any content or collect data, you must know who the report is for: investors, shareholders, or even your employees.
Financials are usually different from employee reports because companies do not want to share too much information about themselves with their employees.
Collecting Data
Reports often require lots of numbers. Data examples for accounting reports typically include:
- Monthly expenses and monthly income
- Sales Increase/Decrease Percentage
- Tax returns
- Financially significant events
It might not be easy finding this kind of data but to write an effective report, you’re going to need it. It would be helpful if you had a meeting with your company’s chief financial officer (CFO).
It’s important to note that these numbers are used throughout the whole report, so they’re an excellent way to establish the overall tone of the document.
Write an Executive Summary
You don’t need to write the entire report right away; however, you should produce an executive summary before drafting any content.
The executive summary welcomes, thank, and inform stakeholders (investors, shareholders, and employees) in a fairly brief manner.
Frequently written by the CEO or CFO (chief financial officer) and is usually between one paragraph and two pages long.
The purpose of this summary is to introduce your company’s business model and strategy, explain why you’re doing what you do, and provide information about your products and services. It should also include any relevant financial data that’ll help readers understand how well your business is performing.
Writing the report
A good report should contain facts, figures, and statistics to help readers understand them better. An example would be using a pie chart to show the percentage of sales coming from different channels (retail vs. online).
You need to write an accurate report by providing facts. Don’t say things like “the company’s profits increased by 10 percent.” Instead, compile the data from which you calculated the increase and explain why the increase occurred.
It might be difficult to show exact numbers for each percentage, so you might want to include them in an appendix instead.
Appendixes compile additional information or statistics that weren’t essential to the main points of the report but might be helpful when confirming them.
Further information to reports plus appendices could include supporting documentation that was not part of the original report.
Summarize and Conclude
The summary part of the report works on the main points of the report by highlighting the most relevant aspects of the study.
In this section, you will summarize the key findings of your research. You may want to start with the conclusions from the data collected during your investigation.
For example, if you found out that the sales of the product were increasing, then you would want to mention it here. If you also found out that the market share of the competitor has increased, then you would want to mention it here too.
Analysis of your report analyzes the information gathered throughout your investigation and presents it in a way that makes sense to the reader. Here, you will discuss the results of the study in more detail. As mentioned earlier, you may use charts, graphs, tables, and other visual aids to help present your findings.
Finally, the end is where you provide your recommendations to the client. These recommendations could be on the study results or stay on your own opinion. Whatever the case may be, make sure to clearly state them at the end of the report.
Final Takeaway
Creating accounting reports for your small business is crucial. These reports help you provide stakeholders with relevant information and stay updated.
Accounting reports for management and finances can be created with ease with the help of accounting software like Vencru.
Make sure you stay tuned to our blog to get more amazing resources to help you navigate the market as a small business. Good luck!


