Running a small business is a thrilling rollercoaster – you’re the captain charting your course, witnessing your dream come to life. But amidst the daily hustle, finances can morph into a confusing beast you don’t quite know how to handle. Having a sample small business chart of accounts provides a guide to transforming your business finances from a tangled mess into a meticulously organized map.
A chart of accounts acts as this roadmap, meticulously categorizing all your income (revenue) and expenses into specific accounts. This newfound organization unlocks a crystal-clear picture of your financial health – an essential tool for any small business owner, regardless of industry.
In this guide, we’ll explore the basics of the chart of accounts for small businesses, including:
- Why is a Chart of Accounts Important?
- How to Build Your Chart of Accounts
- Key Elements of a Chart of Accounts
- Sample Chart of Accounts for a Small Business
- Understanding How Transactions Flow with Journal Entries
- How Vencru Empowers Your Small Business
- Industry-Specific Chart of Accounts
Why is a Chart of Accounts Important?

- Effortless Reporting: A well-organized chart of accounts makes generating insightful financial reports, for example, income statements and balance sheets, a breeze. These reports become your allies, enabling you to track your financial performance, pinpoint areas for improvement, and make strategic business decisions.
- Streamlined Accounting Processes: Categorizing transactions into designated accounts simplifies bookkeeping and minimizes errors. It also translates to smoother tax preparation and ensures adherence to financial regulations.
- Enhanced Efficiency: Imagine a clear and consistent chart of accounts – it saves you valuable time and resources by eliminating confusion when recording transactions.
- Comparative Analysis Made Easy: With a standardized chart of accounts, comparing financial data across different periods or locations becomes a walk in the park. This allows you to identify trends and measure your growth over time.
How to Build Your Chart of Accounts

Now that you understand the power of a chart of accounts, roll up your sleeves and build one for your small business! Here’s a step-by-step guide to navigate the process:
- Research Industry Standards: Familiarize yourself with the standard account names and numbering systems commonly used in your industry. This ensures consistency and facilitates communication with external entities like banks or accountants.
- Tailor it to Your Needs: Your chart of accounts should reflect the unique nature of your business. Consider factors like the products or services you offer, your revenue streams, and your business structure (sole proprietorship, partnership, etc.)
- Start with the Big Five: Most charts of accounts typically include five main categories: Assets, Liabilities, Equity, Revenue, and Expenses. We’ll delve into each of these in the next section.
- Choose a Numbering System: Decide on a numbering system that organizes accounts logically, such as grouping similar accounts or following a hierarchical structure.
- Establish Sub-Accounts: Create sub-accounts within main categories to further classify transactions and provide detailed insights into your financial activities.
- Review and Refine: Regularly review your chart of accounts to ensure it remains aligned with your business needs and financial goals. Make adjustments as necessary to accommodate changes in your operations or reporting requirements.
Key Elements of a Chart of Accounts

Here’s a breakdown of the five essential categories typically found in a chart of accounts, along with some sample of accounts that might fall under each category for a small business:
- Assets: These represent the resources your business owns that have economic value. Examples include cash on hand, inventory, equipment, and accounts receivable (money owed by customers).
- Liabilities: These represent your business’s financial obligations that need to be settled in the future. Examples include accounts payable (money owed to suppliers), loans payable, and accrued expenses (unpaid bills).
- Equity: This represents the ownership interest in the business. For a sole proprietorship, this would be the owner’s equity account, reflecting the initial investment and any accumulated profits or losses.
- Revenue: These accounts record all the income generated by your business’s activities. Examples include sales of products or services, interest earned on investments, and rental income (if you lease out property).
- Expenses: These accounts record all the costs incurred by your business to operate. Examples include salaries and wages, rent and utilities, marketing costs, office supplies, and depreciation (the gradual decrease in the value of assets over time).
Related Read: Chart of Accounts: Definition, example, and industry-specific versions
Sample Chart of Accounts for a Small Business
Asset Accounts
| Account Code | Account Name | Description |
|---|---|---|
| 1000 | Cash | Funds available to cover business expenses held in a checking or petty cash account. |
| 1010 | Inventory | The raw materials, work-in-progress, and finished goods a business holds for sale in the ordinary course of business. |
| 1011 | Raw Materials | The unfinished components used in the production of a finished good. |
| 1012 | Work-in-Progress (WIP) | Goods that are in the process of being produced but not yet completed. |
| 1013 | Finished Goods | Goods that are fully produced and ready for sale to customers. |
| 1020 | Accounts Receivable | Money owed to the business by customers for goods or services purchased on credit. |
| 1030 | Prepaid Expenses | Expenses that are paid for in advance of the related benefit being received (e.g., rent paid in advance). |
| 1040 | Land | The physical land area owned by the business. |
| 1050 | Buildings | Structures (e.g., office buildings, warehouses) owned by the business, less accumulated depreciation. |
| 1060 | Equipment | Tangible assets (e.g., computers, machinery) used in the business operations, less accumulated depreciation. |
| 1070 | Furniture | Movable assets used in the business (e.g., desks, chairs), less accumulated depreciation. |
Liability Accounts
| Account Code | Account Name | Description |
|---|---|---|
| 2000 | Accounts Payable | Money owed to suppliers for goods and services purchased on credit. |
| 2001 | Accounts Payable – Office Supplies | Money owed to suppliers specifically for office supplies purchased on credit. |
| 2002 | Accounts Payable – Inventory | Money owed to suppliers specifically for inventory (raw materials or finished goods) purchased on credit. |
| 2010 | Accrued Expenses | Unpaid expenses that have been incurred but not yet paid. This can include salaries, wages, utilities, and interest. |
| 2011 | Accrued Salaries and Wages | Unpaid salaries and wages owed to employees. |
| 2012 | Accrued Utilities | Unpaid utility bills (electricity, water, etc.). |
| 2013 | Accrued Interest | Unpaid interest on loans or other liabilities. |
| 2020 | Short-Term Loans Payable | Loans that are due within one year from the date they are issued. |
| 2021 | Short-Term Loan – Bank A | A short-term loan from a Bank that needs to be repaid within one year. |
| 2022 | Short-Term Loan – Line of Credit | Line of credit from a bank that can be drawn on as needed, typically due within one year. |
| 2030 | Long-Term Loans Payable | Loans that are due more than one year from the date they are issued. |
| 2031 | Mortgage Payable | Loan secured by real estate property, typically with a term of 15-30 years. |
Equity Accounts
| Account Code | Account Name | Description |
|---|---|---|
| 3000 | Owner’s Equity | This account reflects the initial investment made by the owner(s) of the business. It also tracks any additional capital contributions made by the owners throughout the business’s operation. |
| 3100 | Retained Earnings | This account accumulates the net income (profit) or net loss of the business over time. It represents the portion of the business’s profit that is not distributed to the owners as dividends and is reinvested back into the business for growth. |
Revenue Accounts
| Account Code | Account Name | Description |
|---|---|---|
| 4000 | Sales | Revenue from the core business activity of selling products or services. |
| 4001 | Product Sales | Revenue earned from selling tangible goods to customers. |
| 4002 | Service Sales | Revenue earned from providing intangible services to customers. |
| 4010 | Interest Income | Income earned on interest-bearing accounts, such as savings accounts or bonds. |
| 4020 | Rental Income | Revenue earned from leasing out property or equipment to tenants. |
| 4030 | Gain on Sale of Assets | Increase in value realized when a long-term asset is sold for more than its book value. |
| 4040 | Commissions Earned | Revenue earned by a salesperson on a percentage of sales. |
| 4050 | Other Operating Income | Revenue from incidental business activities that are not part of the core operations, but support them. |
| 4051 | Consulting Fees | Income earned from providing professional consulting services to clients. |
| 4052 | Late Fees | Charges assessed to customers for overdue payments. |
Expense Accounts
| Account Code | Account Name | Description |
|---|---|---|
| 5000 | Salaries and Wages | This account captures the total employee compensation, including salaries, bonuses, commissions, and payroll taxes. |
| 5010 | Rent and Utilities | This account tracks the cost of renting your business facility and utilities such as electricity, water, gas, and internet. |
| 5020 | Marketing and Advertising | This account records all expenses related to marketing and advertising your business, like online ads, print materials, or promotional events. |
| 5030 | Office Supplies | This account captures the cost of consumable office supplies used for daily operations, such as paper, pens, toner cartridges, and ink. |
| 5040 | Depreciation | This account reflects the gradual decrease in the value of tangible assets (equipment, furniture) over their useful life. |
| 5050 | Professional Fees | This account tracks fees paid to professional service providers like accountants, lawyers, or consultants. |
| 5060 | Insurance | This account records the cost of various business insurance premiums, such as liability, property, or worker’s compensation. |
| 5070 | Travel and Entertainment | This account captures expenses incurred for business travel (e.g., flights, hotels) and client entertainment (e.g., meals). |
| 5080 | Loan Interest | This account tracks the interest expense associated with business loans or mortgages. |
| 5090 | Bank Fees | This account records any fees charged by your bank for business account maintenance or transactions. |
| 5100 | Cost of Goods Sold (COGS) | This account, relevant for retail or product-based businesses, reflects the direct costs of the products you sell (materials, labor). |
| 5110 | Other Operating Expenses | This umbrella account captures any other operating expenses not categorized elsewhere, like repairs, maintenance, or bad debts. |
Understanding How Transactions Flow with Journal Entries

Let’s dive deeper into how the accounts in the sample small business chart of accounts above work together through real-world scenarios. To illustrate this, we’ll explore journal entries – the official recordings of financial transactions. Here are three examples demonstrating the practical application of these accounts:
Scenario 1: Selling a Product for Cash (Revenue & Asset Accounts)
- Transaction: You sell a product to a customer for $100 in cash.
- Journal Entry: Debit the Cash account (cash received) by $100 and credit the Sales account (revenue generated) by $100.
Cash (Debit) $100
Sales (Credit) $100
Scenario 2: Paying Rent with Cash (Expense & Asset Accounts)
- Transaction: You pay your monthly rent of $800 in cash.
- Journal Entry: Debit the Rent and Utilities expense account (business cost) by $800 and credit the Cash account (cash paid out) by $800.
Rent and Utilities Expense (Debit) $800
Cash (Credit) $800
Scenario 3: Buying Office Supplies on Credit (Expense & Liability Accounts)
- Transaction: You purchase office supplies for $50 on credit from a supplier.
- Journal Entry: Debit the Office Supplies account (business cost) by $50 and credit the Accounts Payable account (money owed to the supplier) by $50.
Office Supplies (Debit) $50
Accounts Payable (Credit) $50
Related Read: Debits and Credits in Accounting: With Journal Entry Examples
How Vencru Empowers Your Small Business

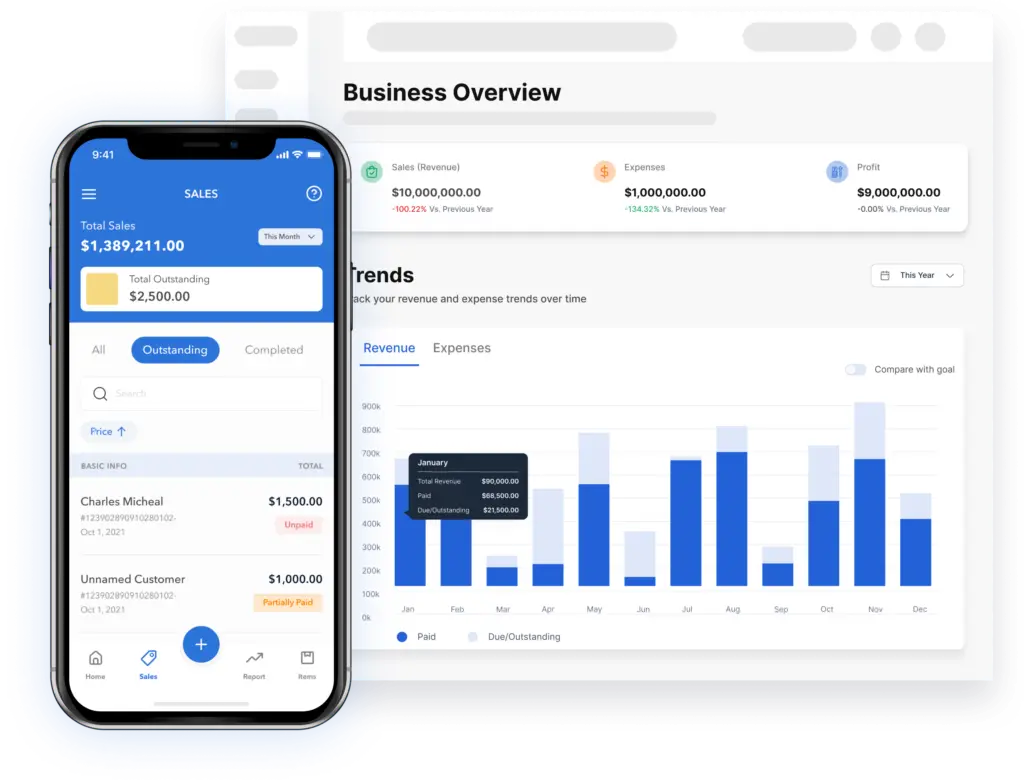
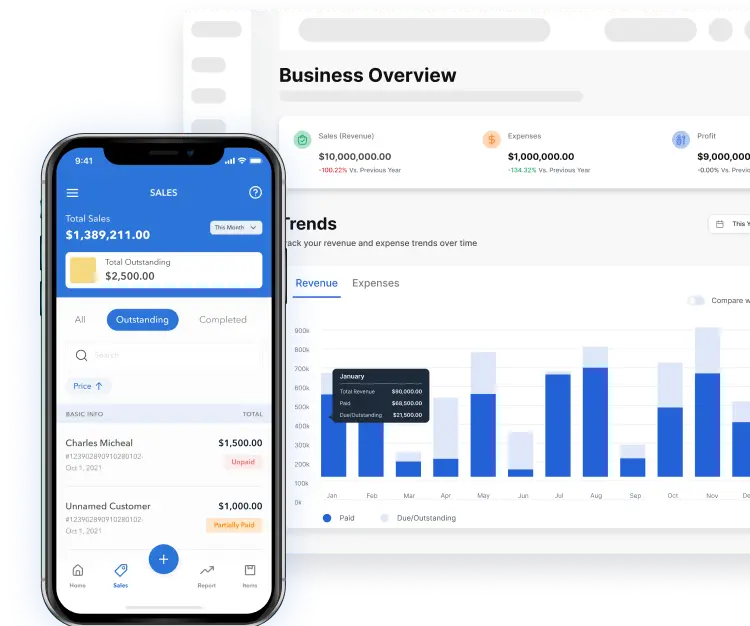
Vencru isn’t just another accounting program. It’s a comprehensive suite of tools designed to simplify and streamline your financial operations, freeing you to focus on what matters most – growing your business. Here’s how Vencru empowers small businesses:
- Effortless Management: Vencru brings invoicing, inventory management, expense tracking, and financial reporting together under one user-friendly platform.
- Clear Insights: Vencru generates insightful reports that help you identify trends, track your cash flow effortlessly, and make data-driven decisions for a prosperous future.
- Streamlined Collaboration: Vencru fosters seamless collaboration with your team or accountant. Share invoices, track expenses, and access financial data anytime, anywhere, on any device.
- Elimination of Errors: Say goodbye to manual data entry and hello to accuracy. Vencru automates workflows, minimizes errors, and ensures you’re always compliant with tax regulations.
- Mobile Accessibility: Manage your finances on the go! Vencru’s mobile apps allow you to create invoices, track expenses, and stay on top of your finances from wherever you are.
Vencru Features Tailored for Small Business Success
- Simple and Intuitive Interface: Vencru’s user-friendly design makes managing your finances a breeze, even for beginners.
- Customizable Chart of Accounts: You can create a personalized chart of accounts tailored to your business’s needs so you can organize your finances in a way that makes perfect sense for you.
- Inventory Management: Effortlessly track your stock levels, manage products, and receive low-stock alerts—all in one place. Say goodbye to stockouts and missed sales opportunities!
- Invoicing and Payment Processing: With Vencru, you can create professional invoices, send them to your clients, and accept online payments seamlessly.
- Scalability: As your business grows, Vencru scales with you. Vencru’s features adapt to your evolving needs, so you’re never left behind.
- Customer Support: Our dedicated customer support team is always here to help you navigate the software and answer any questions you may have.
Ready to explore Vencru? Get started here or book a demo
Industry-Specific Chart of Accounts
While the sample small business chart of accounts we explored offers a strong starting point for most unlocking its full potential lies in customization. Tailoring the chart of accounts to reflect the specific characteristics of your industry allows you to optimize your financial organization for maximum efficiency and clarity.
Here are some resources to get you started on crafting an industry-specific chart of accounts:
- Chart of Accounts for Wholesale Distributors
- Guide to Retail Chart of Accounts (with sample PDF)
- Chart of Accounts for Healthcare Industry
- Chart of Accounts for Rental Property: A Comprehensive Guide
- Chart of Accounts for Nonprofit: A Comprehensive Guide
- Chart of Accounts for Transportation and Logistics Business
- Chart of Accounts for a Construction Company: Detailed guide
- Chart of Accounts for e-commerce businesses: Detailed guide
- Guide to Restaurant Chart of Accounts (with sample PDF)


